
The Disassembly
In this post, we will look at some actual code. But first the answers to the questions from the previous post:
- What is a bit? How many values can a bit contain?
- The most elementary piece of data. Can contain 0 or 1.
- What is a byte? How many values can a byte contain?
- 8 bits. 256 values (0 to 255)
- How many values can a hex digit contain? How many digits does a byte have in hex?
- 16 values. 2 hex digits in a byte (as we’ve seen a lot already in the memory window)
- Why is 16 the magic number in the memory window?
- Because that is how many values one digit can contain. So it is like ’10’ in the decimal system. It allows data to be presented neatly with all addresses ending on the same digit to be displayed below each other.
Until now, we have looked at the Z80 memory only as a holder of ‘passive’ program data. This data can also be interpreted as executable instructions. In fact, the Z80 does not differentiate between executable instructions and program data. This means the developers have to keep track of what pieces of memory are instructions and what pieces are memory. If they get mixed up, it will lead to catastrophic program failures. To have a look at those instructions, open the ‘Disassembly’ window.
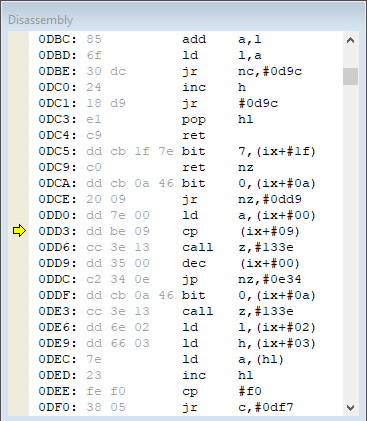
As you can see, the data here is presented as instructions. The memory addresses are the same as before, and the content are thus the same too. For example, use menu item Debug -> Go To to go to memory address #2300 (the data of SELIOS) and you can see that that data can be interpreted as instructions too. But this code you never want to execute of course, since they are nonsense! It just goes to show that there is no distinction between program data and instructions. Developers had to take real care not to jump to non-instructions data, and also not to change memory that actually contains instructions!
As you can see on address #2300, the value 00 is a nop instruction. This means: do nothing. At #2302 you see that the values 01 0a 0a which are on address #2302, #2303 and #2304 actually translate to the instruction: ld bc, #0a0a. For now we will not go into what that means.
Some real code
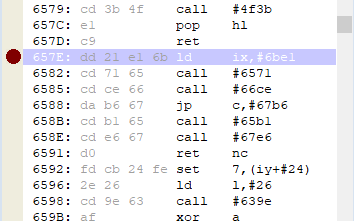
Now let’s go look at some actual program code. I have figured out at address #657E is code that is executed when hitting an enemy. So let’s go there and put a breakpoint there. Just click in the line before the address.
Go back to the game (unpause if needed) and find some enemies. If you hit the enemy, or the enemy hits you, you will see the program breaks on that statement, because a yellow arrow is shown there. Now first go back to the game (do not unpause) and press F8 to quicksave the computer state. This will become in handy later on. It is really easy to loose track of where you are, and pressing F7 to quickload state again is the way to start over. When we have done that, we can safely step through the program execution, but first a little explanation about program flow.
Program flow
When a program is executed, the processor is always running the current expression at an address. It executes the expression and then moves to the next expression. Most expressions take up more than one byte of memory, but the processor will automatically move to the next statement. So after executing the expression at #657E, the active expression will be the one at #6582. In the debugger you can click on Step Over (or press F10) to do this.
Some expressions control program flow. The most used are:
call address: This will call a subroutine at the address, so the next expression to execute is at that address. It will return when a ret is executed.
ret: Execution will go back to the statement which is first after the last call.
jp address: Execution will jump to the address. Execution origin is forgotten, so not possible to return with ret. Most jp instructions are conditional, meaning that the jump will only take place if conditions are met.
jr offset: Like jp, but execution will go forward offset bytes in memory. So jr 10 will jump forward 10 bytes.
If you look at address #6582, you can see there is a call statement there. Here there are two debugging options. If F10 is pressed, the execution will ‘step over’ the call. This means that everything that is inside the call will be executed at once until a ret is found and execution will commence on address #6585.
If F11 is pressed, however, the execution will ‘step into’ the call. So it will move to the address being called and stop there. So press F11 for now (if you already pressed F10 to step over, just go back to the game, reload the machine state and start over).
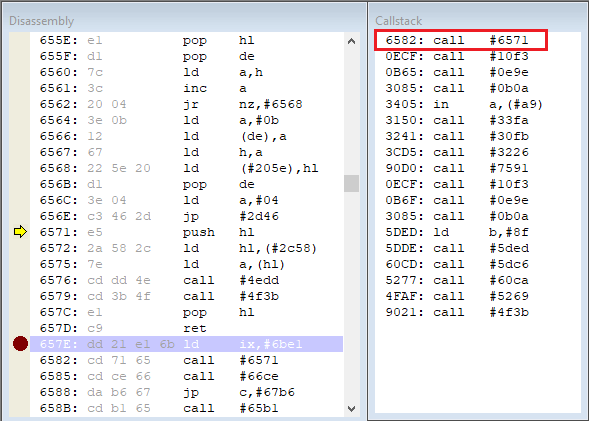
As we can see, the execution is indeed as expected at address #6571. Also what we can see is that the origin address #6582 is added to the call stack. See the Callstack window to see this happen. This is the way the processor keeps track of all call executions. There may be other call expressions inside the called subroutine before we get to a ret. And there may be other call expressions inside those subroutines. We can see this on address #6576 if we step into this routine again, another entry will be added to the call stack.
So whenever a call is executed, this is added to the top of the call stack. Whenever a ret is executed, the last entry is taken from the top of the call stack and the execution is returned to the statement following the original call statement. In the call stack, it is clear that also non-call statements are present. I currently do not know why they are there, so I ignore them. It may be a bug in BlueMSX displaying the call stack incorrect.
You can now step out of the last called function by pressing SHIFT F11. This will continue execution until the ret is found in the current subroutine. Then it will break again on the expression following the call. The last entry will be removed from the call stack.
If you want to resume execution of the program again, press F5. The program will then run until a breakpoint is hit again, or the game is pause with F9.
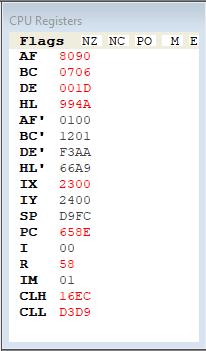
Now load the stagefile I have included above and hit the first enemy. If you did not delete your breakpoint at #657E , the program will break again there. Run the code until addres #658E. You can either put a breakpoint here and press F5, run with F10 until you get here, or hilight the address line and choose in the menu Debug -> Run To Cursor (or press shift F10). Look at another window, the CPU registers. We will not discuss them now, but you might recognize some of the values that are stored there. Two of them, we discussed before. The third one can be recognized if I tell you that the damage that will be done in this hit is 29.
Now, with RO, hit one of the enemies. Let the program break on #657E. Now step with F10 until you are on #6588. This is a conditional jp instruction. When we hit with SELIOS before, the condition was false, and we stepped to the next instruction. Now with RO, however, we will see that if we press F10, we will actually jump to the address mentioned in the jp statement: jp c, #67b6. So the condition is true apparantly this time. Now go back to the game and press F9 to continue. Can you spot what is different from the SELIOS hit? You can always load back the statefile and repeat the process.
If you answered the questions above, you have some clues on what the code does. In the next post, we will look into how this actually works and we will even modify some of the logic in our first attempt to make an altered version of the game! So the fun is about to begin!
Geef een reactie